If you’re a fan of our HTTP/S lookup tools, you may have noticed that we added a new feature: Screenshots. Now, when you run an HTTP or HTTPS lookup on a domain you will see a screenshot of what the domain looked like when we ran the test. If there is an error, you now have more information on what error may have occurred.
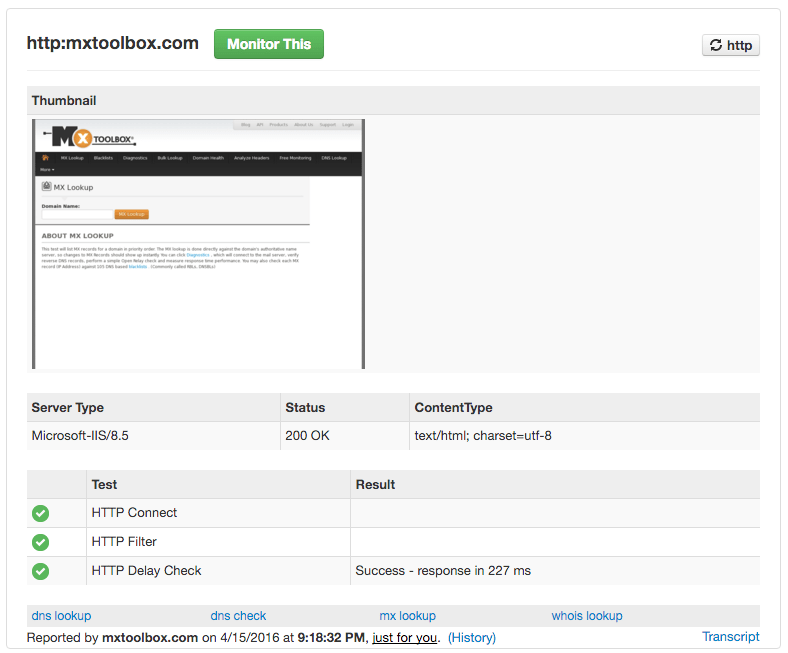
For example: if your server was down when running the test you will see a screenshot of what your customers saw as well as any error codes.
We’ve also added this same capability to our monitoring system! Now, when we verify your server or website is down, we will include a screenshot in the alert notification we send you. You get a snapshot of what your customers see when an outage occurs. Over nights and weekends, on-call teams will be able to directly see what is going on right away and make the best triage decision for the alert.
In addition, monitoring customers can also access a historical screenshots for HTTP/S monitor outages. Whenever we capture and verify a transition event, UP or DOWN, we store the screenshot in your monitor history. Now, you will always have a view into site performance and customer experience!
